Timeseries Data Model
Timeseries Data Model
1. What is Time Series Data?
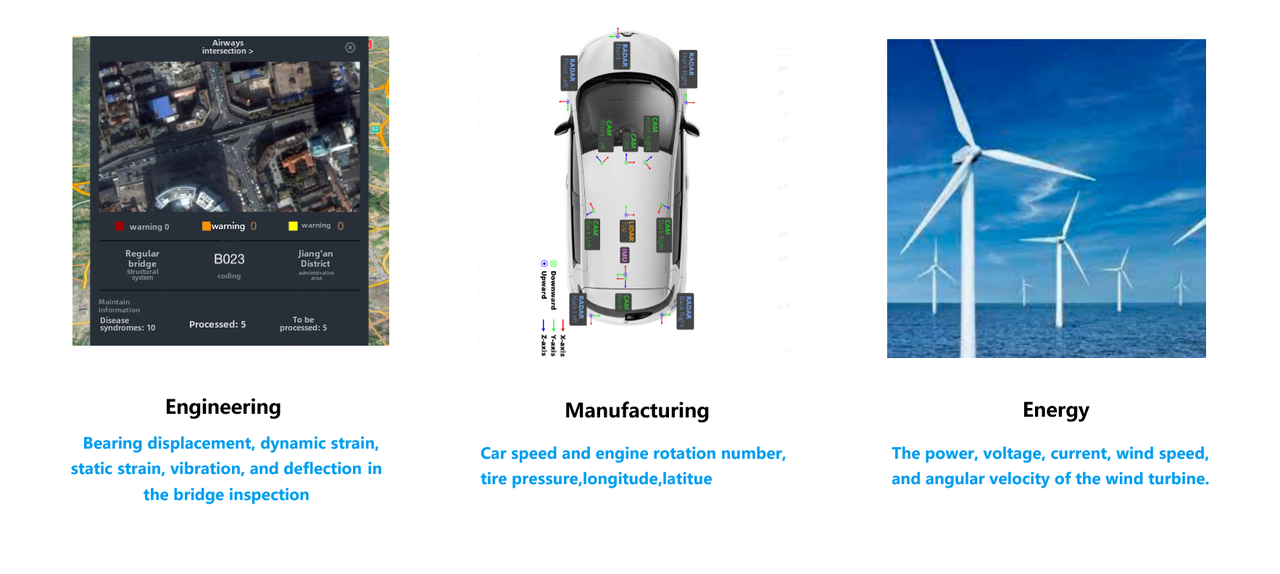
In today's interconnected world, industries such as the Internet of Things (IoT) and manufacturing are undergoing rapid digital transformation. Sensors are widely deployed on various devices to collect real-time operational data. For example:
- Motors record voltage and current.
- Wind Turbines track blade speed, angular velocity, and power output.
- Vehicles capture GPS coordinates, speed, and fuel consumption.
- Bridges monitor vibration frequency, deflection, and displacement.
Sensor data collection has permeated almost every industry, generating vast amounts of time series data.
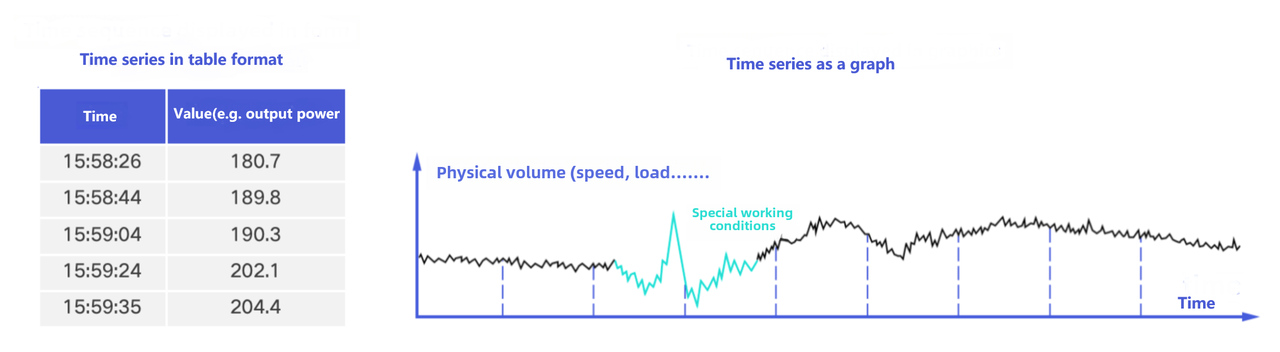
Each data collection point is referred to as a measurement point (also known as a physical quantity, time series, signal, metric, or measurement value). As time progresses, new data is continuously recorded for each measurement point, forming a time series. In tabular form, a time series consists of two columns: timestamp and value. When visualized, a time series appears as a trend chart over time, resembling an "electrocardiogram" of a device.
Given the vast amount of time-series data generated by sensors, structuring this data effectively is essential for digital transformation across industries. Therefore, time-series data modeling is primarily centered around devices and sensors.
2. Key Concepts in Time Series Data
Several fundamental concepts define time-series data:
| Device | Also known as an entity or equipment, a device is a real-world object that generates time-series data. In IoTDB, a device serves as a logical grouping of multiple time series. A device could be a physical machine, a measuring instrument, or a collection of sensors. Examples include: - Energy sector: A wind turbine, identified by parameters such as region, power station, line, model, and instance. - Manufacturing sector: A robotic arm, uniquely identified by an IoT platform-assigned ID. - Connected vehicles: A car, identified by its Vehicle Identification Number (VIN). - Monitoring systems: A CPU, identified by attributes such as data center, rack, hostname, and device type. |
|---|---|
| FIELD | Also referred to as a physical quantity, signal, metric, or status point, a field represents a specific measurable property recorded by a sensor. Each field corresponds to a measurement point that periodically captures environmental data. Examples include: - Energy and power: Current, voltage, wind speed, rotational speed. - Connected vehicles: Fuel level, vehicle speed, latitude, longitude. - Manufacturing: Temperature, humidity. |
| Data Point | A data point consists of a timestamp and a value. The timestamp is typically stored as a long integer, while the value can be of various data types such as BOOLEAN, FLOAT, or INT32. In tabular format, a data point corresponds to a single row in a time-series dataset, while in graphical representation, it is a single point on a time-series chart. 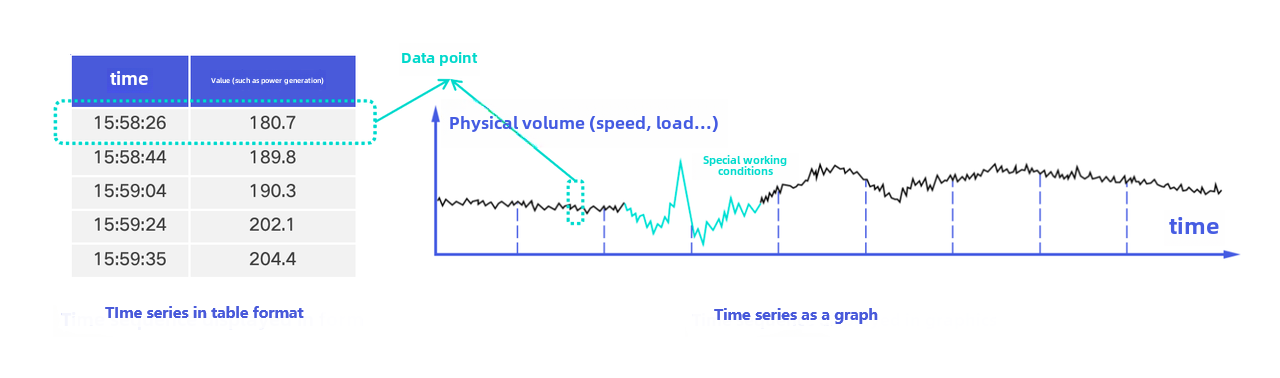 |
| Frequency | The sampling frequency determines how often a sensor records data within a given timeframe. For example, if a temperature sensor records data once per second, its sampling frequency is 1Hz (1 sample per second). |
| TTL | TTL (Time-to-Live) defines the retention period of stored data. Once the TTL expires, the data is automatically deleted. IoTDB allows different TTL values for different datasets, enabling automated, periodic data deletion. Proper TTL configuration helps: - Manage disk space efficiently, preventing storage overflow. - Maintain high query performance. - Reduce memory resource consumption. |